Who started?
Define the population the claim is supposed to describe, including its time period.
The people still visible may be different from those who left. Name the missing group before drawing a conclusion about everyone.
Use the free template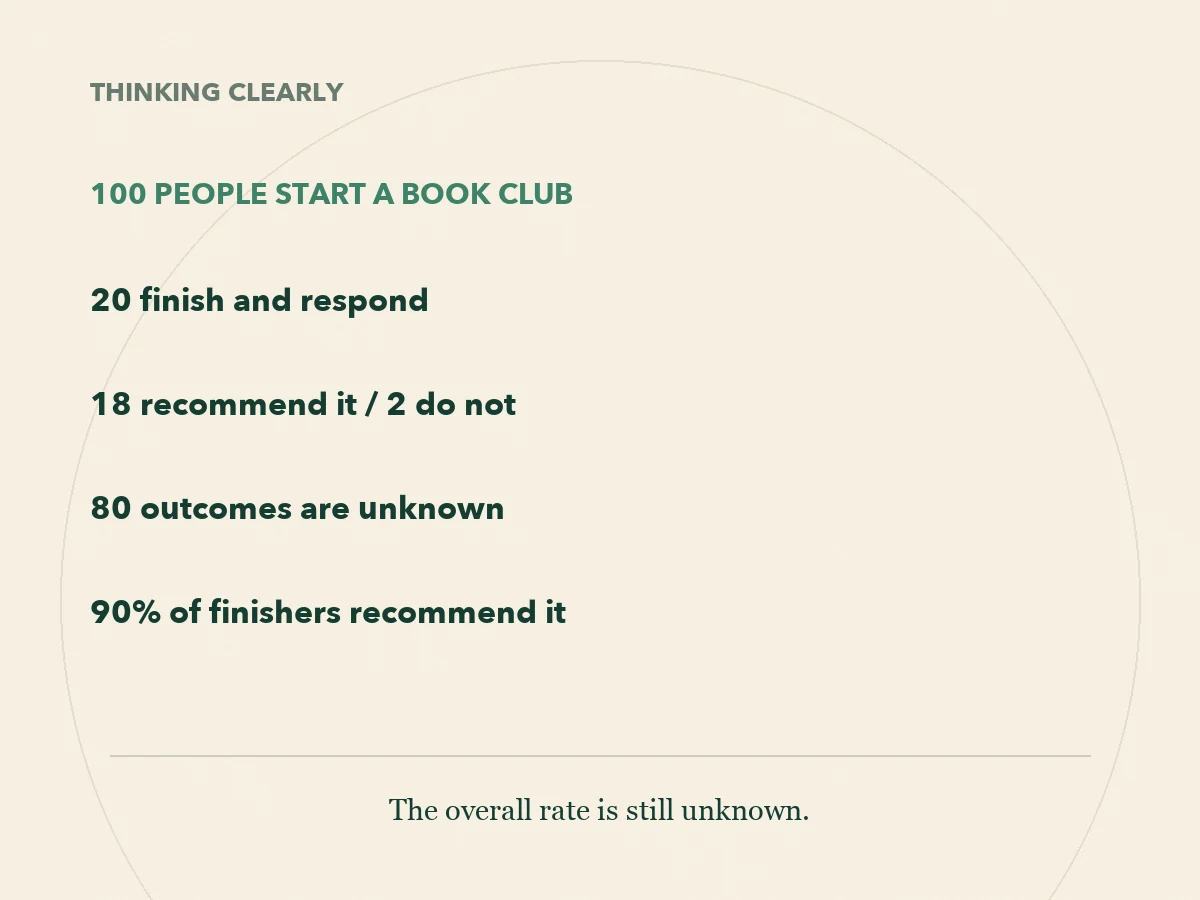
You hear that nearly everyone who finished a reading challenge loved it. That can be true while telling you very little about everyone who started. The key question is what happened to the people who stopped showing up.
The examples below are invented. They teach a way to inspect a claim, not a claim about the success rate of a real club, course, business or app.
The short answer
Survivorship bias occurs when you draw conclusions from the people or things that made it through a selection process while overlooking those that did not. Check the starting population, the rule for remaining visible and the outcomes of missing cases. Unknown outcomes are neither successes nor failures.
The method
Write these four lines before accepting a success story as evidence about a whole group.
Define the population the claim is supposed to describe, including its time period.
Identify the filter: finishing, winning, staying open, responding or being chosen for a profile.
Count missing cases if possible and find out why they disappeared. Do not assign them outcomes you have not observed.
State the result for the observed group, and name what is still unknown about the wider population.
Free worksheet
Use this plain-text worksheet with your own example. It is free to read and download without an account.
Download worksheet (.txt)MISSING CASES WORKSHEET Learning Cadence | Original worksheet | 18 October 2026 Claim being made: Starting population and period: Rule for appearing in the evidence: Number observed: Number missing: Known positive outcomes: Known negative outcomes: Unknown outcomes: What the observed group supports: What we cannot infer about everyone: How to investigate missing cases: Other explanations besides the proposed cause:
Work through it
Imagine 100 people join a six-week book club. Twenty finish the challenge, and all twenty answer a final question. Eighteen say they would recommend it. The organizer reports: 90% of finishers recommend the club.
That statement is supported: 18 ÷ 20 = 90%. But changing it to 90% of everyone who joined recommends the club is unsupported. The other 80 people were not asked, and finishing may be related to enjoyment, available time or other factors.
What can we say about all 100? Eighteen are known to recommend it and two are known not to. If none of the missing 80 would recommend it, the overall rate is 18%. If all would, it is 98%. That 18% to 98% range is a logical bound under the example, not a confidence interval or an estimate that every value is equally likely.
Calling all 80 non-finishers dissatisfied would be another mistake. Their outcomes are unknown. Ask them, record response rates, and consider whether the people who answer a follow-up differ from those who still do not.
Work through it
Imagine 100 applicants, of whom ten receive an offer. Eight of those ten have a portfolio. A profile concludes: Building a portfolio gives you an 80% chance of an offer.
Eight out of ten describes portfolios among successful applicants. It does not describe success among portfolio holders. To calculate that second proportion, you need the number of portfolio holders among all applicants.
If there were ten portfolio holders overall, eight received offers: 80%. If there were 80 portfolio holders overall, eight received offers: 10%. Both possibilities fit the same eight-out-of-ten observation. Neither comparison alone establishes that the portfolio caused the offer.
Work through it
Survivorship bias is a form of selection bias: inclusion in the observed group depends on making it through a process. Nonresponse can create an additional selection problem when the people who answer differ from those who do not.
UC Berkeley’s sampling chapter explains that the group available for sampling can differ from the population of interest, and that accessible or responding cases do not automatically form a representative sample. In the book-club example, restricting the survey to finishers creates the first gap before anyone answers.
Work through it
Original exercise: a gallery shows 12 prize-winning posters. Nine use a dark background. Someone advises every entrant to choose a dark background because it wins 75% of the time. What information is missing?
Answer check: you need the numbers of dark-background and other posters among all entries, plus how winners were selected. Nine out of twelve is the proportion of winners with dark backgrounds. It is not the proportion of dark-background entries that win. Other design differences could also affect the outcome.
A better conclusion is: Nine of the twelve displayed winning posters use dark backgrounds. That observation can inspire a design question, but it does not establish a winning strategy.
Work through it
A detailed account of one successful person may supply a technique worth trying or a hypothesis worth testing. Keep that narrower use separate from estimating how often the technique works or whether it caused success.
When a decision needs a success rate, seek a defined starting group and consistent follow-up. When outcomes remain missing, report that gap. A large collection of survivors cannot recover the cases excluded by its selection rule.
We make Cadence. These examples and worksheets are free to use on their own. If you want more structured practice, explore the suggested learning goals below.
Put it into practice
If you want to keep going, Cadence turns what brought you here into a course of short daily lessons with practice and saved progress. Cadence is our app.


Want new features first?
Questions
No. They can suggest ideas and describe individual experiences. They do not, by themselves, show how often the same approach works among everyone who tries it.
Only if failure is actually established under the outcome definition. Otherwise their outcomes are unknown. Report the missing group and investigate it.
Survivorship bias concerns which cases remain visible after selection. Confirmation bias concerns how evidence is sought or interpreted in relation to an existing belief. Both can affect the same argument.
More survivors do not automatically represent everyone who started. Check the selection rule and missing cases as well as the number observed.
See it in concrete terms
Carry the missing-case check into everyday decisions and research reading.
Catch your own mental shortcuts before they decide for you.
Read a scientific paper and explain what its evidence supports.
Judge chance and odds in real life, not just on dice.
Sources

Try Cadence today
Describe what you want to learn and Cadence builds a course of short daily lessons you can read or play as audio. It is free to start on iPhone and Android.
Want new features first?