Start with the base rate
Split the inbox into spam and ordinary messages before applying the flagging rates.
A flag can be correct or mistaken. How common the underlying event is changes the balance between those two routes.
Use the free template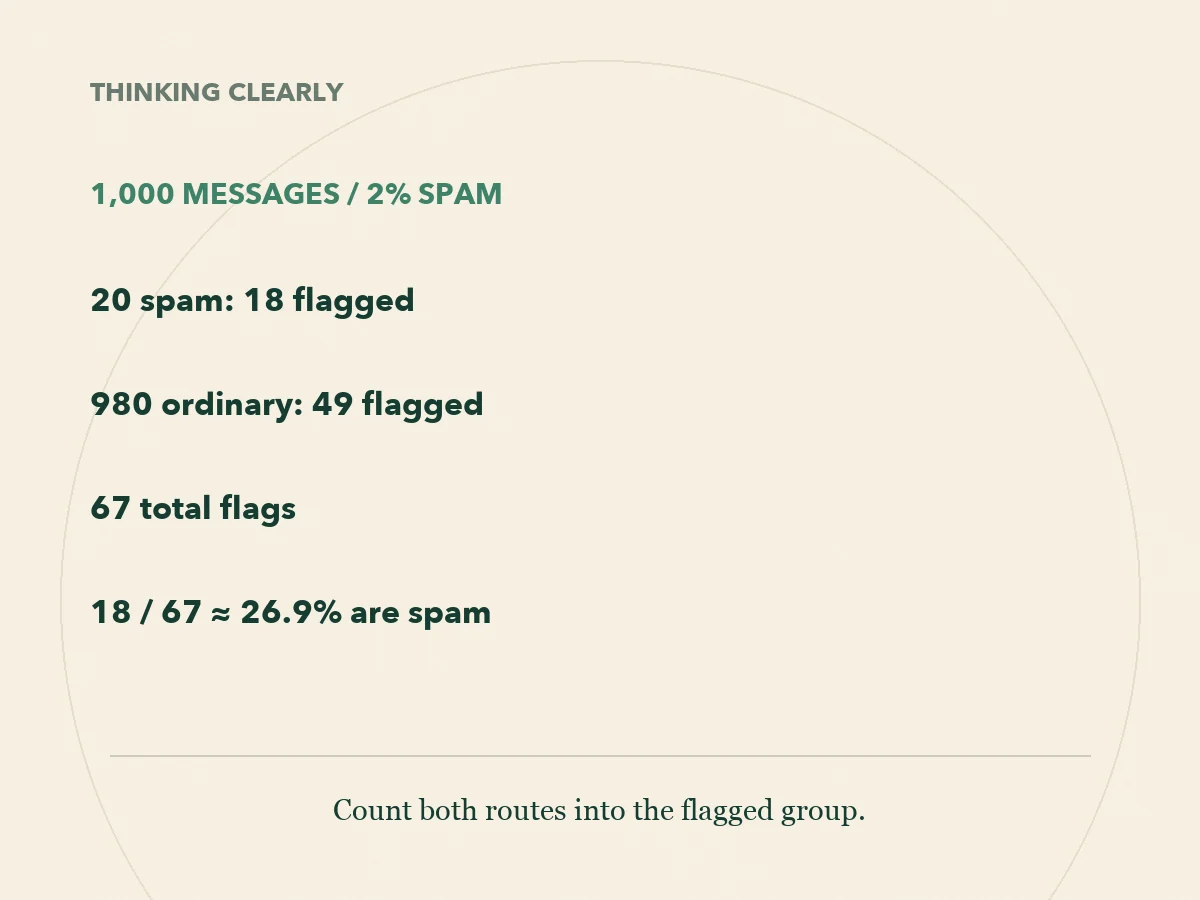
A fictional spam filter flags 90% of spam. Does a flagged message therefore have a 90% chance of being spam? No. You also need to know how many ordinary messages get flagged and how common spam is in the inbox.
The examples here use invented message counts, not measurements of any real filter. They isolate one probability mistake without asking you to make a medical, financial or hiring decision.
The short answer
The base rate is how common something is in the relevant group before a new signal. Base rate neglect happens when that background rate is ignored or given too little weight. To interpret a positive signal, count both true and false positives, then divide true positives by all positives.
The method
Choose a common starting population so the denominators stay visible.
Split the inbox into spam and ordinary messages before applying the flagging rates.
Multiply the number of spam messages by the rate at which spam is flagged.
Multiply the number of ordinary messages by the rate at which ordinary messages are flagged.
The probability of spam given a flag is true positives divided by true positives plus false positives.
Free worksheet
Use this plain-text worksheet with your own example. It is free to read and download without an account.
Download worksheet (.txt)BASE RATE COUNT WORKSHEET Learning Cadence | Original worksheet | 18 October 2026 Population and time period: Source of each rate: Total cases N: Cases with event E = N x base rate: Cases without event = N - E: True positives = E x detection rate: False positives = (N - E) x false-positive rate: All positives = true positives + false positives: Event given positive = true positives / all positives: Assumptions and uncertainty: Check: are both rates applicable to this population?
Work through it
Take 1,000 messages. Suppose 2% are spam: 20 spam messages and 980 ordinary messages. The filter flags 90% of spam and 5% of ordinary messages.
Spam flagged: 20 × 0.90 = 18. Ordinary messages flagged: 980 × 0.05 = 49. The flagged group therefore contains 67 messages, of which 18 are spam.
The requested proportion is 18 ÷ 67, approximately 26.9%. The 90% figure answers a different question: among spam messages, how many are flagged? Swapping that denominator to all flagged messages creates the error.
The flag still carries information. In this example it raises the spam probability from 2% to about 27%. A signal can be informative even when most flagged cases are false positives.
Work through it
Now imagine 1,000 messages with 20% spam, keeping both flagging rates fixed. There are 200 spam messages and 800 ordinary messages. The filter flags 180 spam messages and 40 ordinary messages.
Of the 220 flagged messages, 180 are spam: 180 ÷ 220, approximately 81.8%. The filter rates did not change. The mix of messages did. This comparison is why a detection rate alone cannot answer the after-a-flag question.
Work through it
Brown University’s Seeing Theory explains Bayes’ theorem as a way to reverse a conditional probability using the prior probability and the signal rates. Our count method performs the same calculation with an invented inbox.
In symbols, P(spam | flag) = P(flag | spam) × P(spam) ÷ P(flag). The total flag probability includes both routes: flagged spam and flagged ordinary messages. Here, that denominator is 0.90 × 0.02 + 0.05 × 0.98 = 0.067.
Work through it
Original exercise: another fictional inbox has 2,000 messages, of which 1% are spam. A filter flags 80% of spam and 2% of ordinary messages. Using expected counts, what fraction of flagged messages is spam? Try it before reading on.
Answer: 20 are spam and 1,980 are ordinary. Expected true flags are 16; expected false flags are 39.6. The fraction is 16 ÷ 55.6, about 28.8%. The fractional count is an expectation under the stated rates, not a claim that a real message can be divided into pieces.
Work through it
The inbox examples assume the rates are known and apply to the inbox being considered. Real rates may be estimated, change over time or differ across groups. A base rate from a very different population can mislead too.
Ask where each number came from, which group it describes and whether the same definitions were used. If the base rate is unknown, compare plausible scenarios and label them as assumptions instead of supplying a precise-looking answer.
A base rate is a starting point, not a reason to ignore strong case-specific evidence. Update it with relevant evidence. Also keep probability separate from action: the cost of a false alarm or a missed case affects what action is sensible, but does not change this arithmetic.
We make Cadence. These examples and worksheets are free to use on their own. If you want more structured practice, explore the suggested learning goals below.
Put it into practice
If you want to keep going, Cadence turns what brought you here into a course of short daily lessons with practice and saved progress. Cadence is our app.


Want new features first?
Questions
A filter catches 90% of spam, but that does not mean 90% of flagged messages are spam. In the invented example above, 18 true flags and 49 false flags make the proportion about 26.9%.
It is specifically about underweighting the background frequency. A sound update uses both that frequency and the strength of the new evidence.
When the event is rare, even a small false-positive rate applies to a large group without the event. Those false positives can outnumber the true positives.
Do not invent one. Find evidence for the relevant population or compare clearly labelled scenarios. The resulting range depends on those assumptions.
See it in concrete terms
Practise the probability calculation and the habit of checking your assumptions.
Judge chance and odds in real life, not just on dice.
Catch your own mental shortcuts before they decide for you.
Read a scientific paper and explain what its evidence supports.
Sources

Try Cadence today
Describe what you want to learn and Cadence builds a course of short daily lessons you can read or play as audio. It is free to start on iPhone and Android.
Want new features first?